pyCMBS gallery
In the following, examples will be given that introduce different features of pyCMBS.
Basic plotting
Read some sample data and just plot it:
from pycmbs.mapping import map_plot
import matplotlib.pyplot as plt
from pycmbs.examples import download
import numpy as np
# Read some sample data ...
air = download.get_sample_file(name='air')
air.label = 'air temperature'
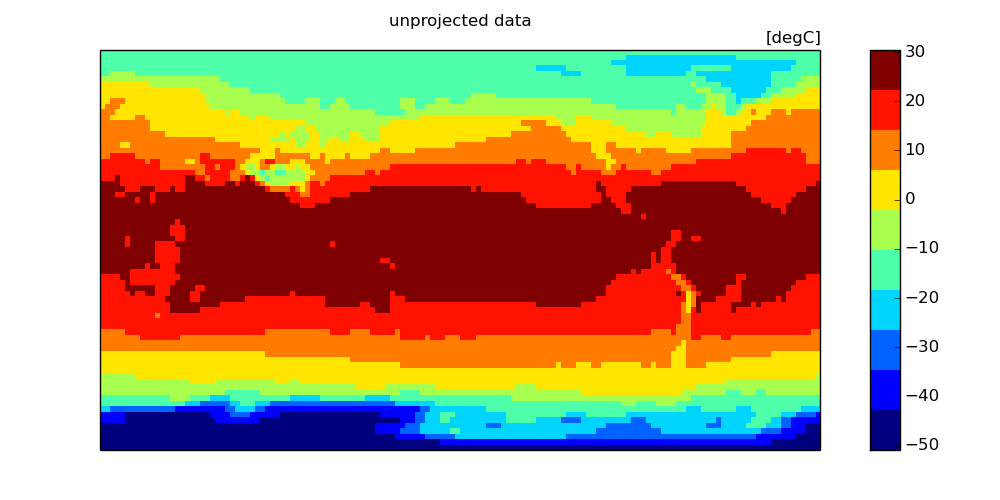
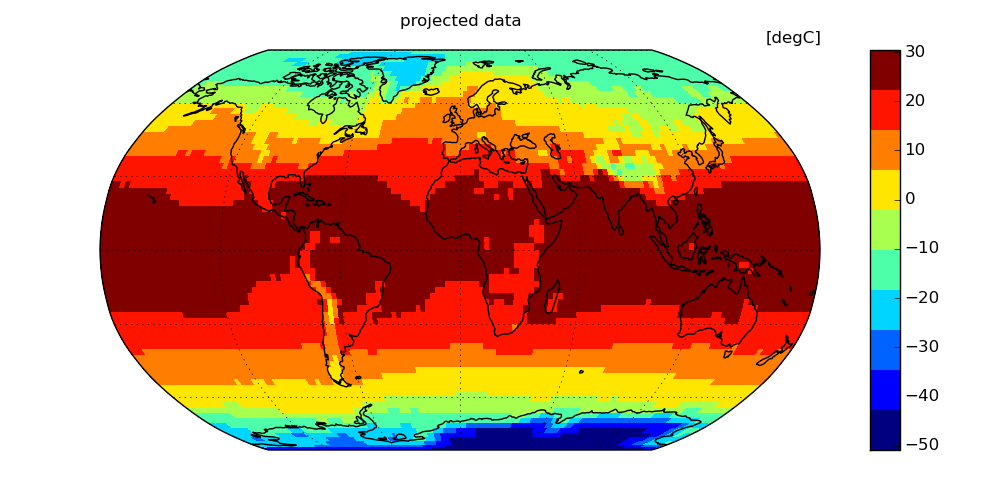
# a quick plot as well as a projection plot
f1 = map_plot(air) # unprojected
f2 = map_plot(air, use_basemap=True) # projected
plt.show()
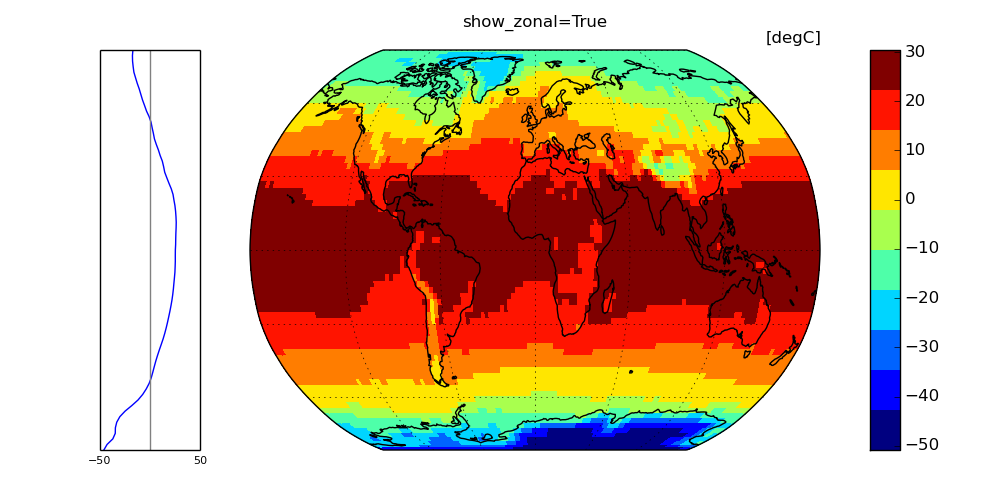
For plotting you have a rich suite of keyword parameters. Please use the python help() system to get full documentation from docstrings. Some more illustrations of options are provided:
map_plot(air,show_zonal=True, use_basemap=True,title='show_zonal=True')
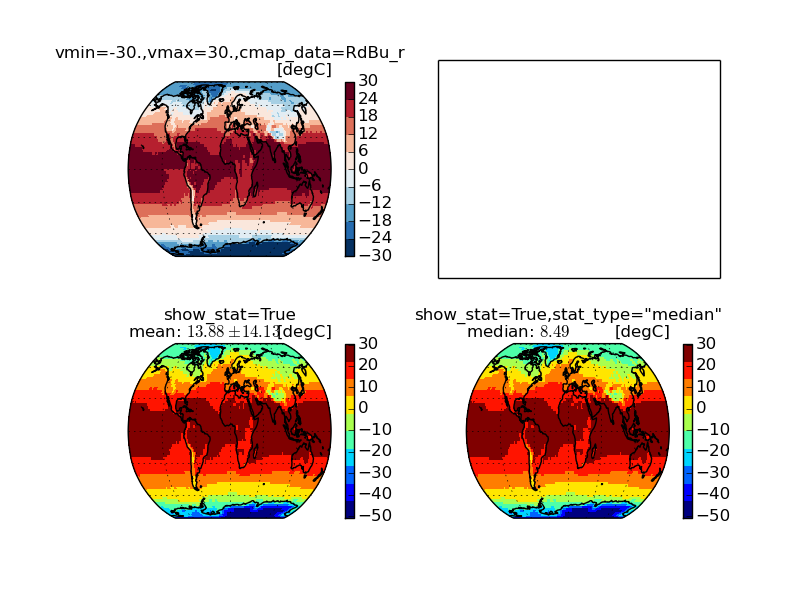
And a few more details on customizing your map ...:
map_plot(air, use_basemap=True, title='vmin=-30.,vmax=30.,cmap_data=RdBu_r', vmin=-30., vmax=30., cmap_data='RdBu_r', ax=ax1)
map_plot(air, show_stat=True, use_basemap=True,title='show_stat=True',ax=ax3)
map_plot(air, show_stat=True, stat_type='median', use_basemap=True, title='show_stat=True,stat_type="median"', ax=ax4)